

Widely cited email open rate benchmarks put the global average somewhere between 35% and 44% – a number clean enough to screenshot and reassuring enough to quote in a deck. The problem is that single figure is doing a lot of heavy lifting for an enormous range of industries, list profiles, and measurement methods.
Before you grade your program against anyone else’s report, you need to know what those numbers are actually counting, who they’re counting it for, and why Apple’s privacy changes may have quietly inflated every open rate you’ve seen since 2021. The answers change how you set expectations, diagnose problems, and pick the metrics worth tracking.
Email Open Rate Benchmarks: What the Numbers Say Today
Industry benchmarks for email open rates converge on a blended average of 35–44%, drawn from platform reports by HubSpot and Mailchimp – but that single range collapses the moment you look one level deeper at what’s actually driving it.
The variation by sector is wide enough to make the blended figure nearly useless on its own. E-commerce and retail programs typically land between 28–33%. B2B and SaaS sit a little higher at 30–38%. Nonprofit and education programs consistently outperform both, averaging 40–52%, largely because their subscribers opted in with high intent and receive relatively low email volume. Automated and triggered flows – welcome sequences, abandoned cart reminders, post-purchase follow-ups – span the widest range of all, from 31% to as high as 55%, according to data from MailerLite, HubSpot, and Mailchimp.
That last category deserves a moment. Automated flows consistently outperform batch campaigns by a significant margin, and it’s not because the subject lines are better written. It’s because the email arrives at a moment of demonstrated intent – someone just joined your list, left something in their cart, or completed a purchase. Timing relative to behavior is the variable doing the work, not volume.
Here’s a closer look at how those numbers break down across the dashboard marketers actually use.
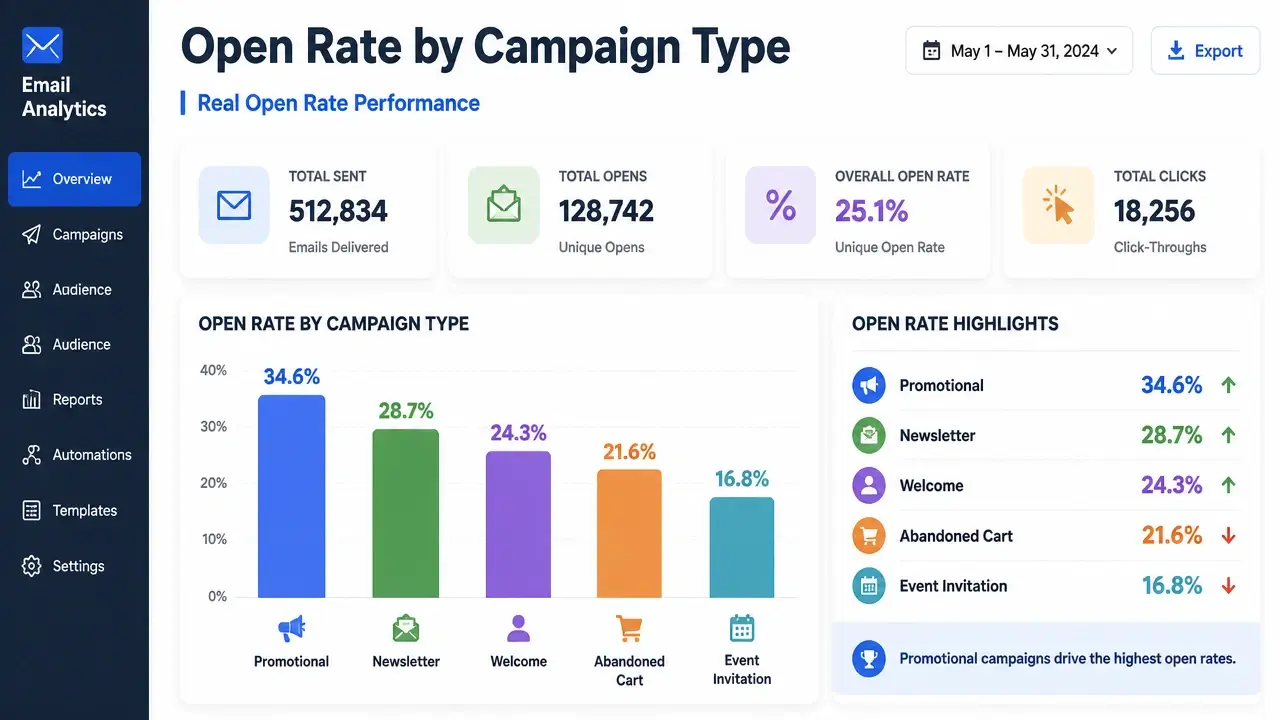
Treat these figures as a rough compass for orienting yourself, not a scoreboard for grading your program. The right benchmark for your situation depends on your list’s opt-in recency, your send frequency, your sender reputation, and – critically – which platform generated the report you’re reading.
The academic research reinforces why that last point matters. MDPI Academic Research Publishing, analyzing real-world platform datasets at scale, notes:
“The average value of the indicator is influenced by factors such as the industry, the time of sending, the country, etc. The highest average value is found in the financial sector, with a percentage of approximately 16.68 [for click-to-open rate metrics].”
The geography variable alone – which most benchmark reports bury or ignore entirely – can shift reported averages by several percentage points. A benchmark built on a U.S.-heavy client base will read differently from one built on a European or Southeast Asian mix, even within the same sector. That’s not a footnote. It’s the reason the blended average can only ever be a starting point.
Why Industry Averages Can Be Dangerously Misleading
Benchmark reliability factors are far more fragile than the confidence with which they get cited – and understanding why they break down is more useful than memorizing the numbers themselves.
Start with list quality. A list built from recent, confirmed opt-ins with a clean engagement history and no spam traps will produce dramatically different open rates than a list that was scraped, purchased, or never properly pruned. We’re talking single-digit open rates on one end and 50%+ on the other. When a platform averages across both types of lists and calls it an “industry benchmark,” the resulting number describes neither situation accurately.
Send frequency distorts the picture in a different direction. Brands that mail daily or near-daily naturally accumulate a higher proportion of disengaged subscribers, pulling their reported open rates down. A brand that sends once a month to a tight, highly engaged list will show elevated numbers – not because they’re better at email marketing, but because infrequent contact keeps the disengaged from piling up in the denominator. Both programs get folded into the same benchmark report.
The platform problem runs even deeper. Different ESPs serve fundamentally different client mixes. A platform built around e-commerce brands will generate benchmark data that skews toward transactional email behavior. A platform that serves B2B companies will skew toward professional outreach patterns. When you read “the industry average for e-commerce,” what you’re often reading is “the average for e-commerce brands that happen to use this particular platform” – a distinction that rarely makes it into the headline.
And then there’s the definitional problem. No two major platforms define “delivered” or “unique open” identically. Subtle differences in how bounces are handled, how duplicate opens from the same recipient are counted, or how bot opens are filtered can shift the final reported number by several percentage points – even when both platforms are processing identical raw data.
The cross-source evidence makes this concrete. Here’s what different platforms report for the same sector:
| Platform | E-Commerce Open Rate Reported |
|---|---|
| Mailchimp | 19.71% |
| Klaviyo | 33.1% |
| MoEngage | 32.59% |
That’s a 13-percentage-point spread for the same industry. There’s no single “e-commerce average” – there are only platform-biased snapshots, each shaped by who that platform’s customers are and how that platform counts.
None of the major benchmark reports disclose their sampling criteria, geographic distribution, or statistical confidence intervals. Scale alone – billions of emails processed – is not a substitute for methodology. Before trusting any benchmark, look for a methodology appendix. If it isn’t there, treat the number as directional at best.
More practically: build your own internal trailing 12-month baseline. Your program’s history, segmented by email type and list cohort, will tell you more about where you actually stand than any external report ever will.
The Variables That Actually Drive Open Rates
Controllable open rate factors give you more leverage than benchmarks suggest – but only after you’ve confirmed your emails are actually reaching the inbox.
Subject line length and framing matter more on mobile than anywhere else, and mobile now accounts for over 41% of all email opens. Subject lines beyond 50 characters get truncated on most mobile clients, cutting off the message before it can do its job. Keeping subject lines to 6–10 words – tight, actionable, curiosity-driven language without spam triggers – consistently outperforms longer variants. A peer-reviewed field experiment published in the Advances in Social Sciences Research Journal confirms this directly: subject lines with fewer characters achieve higher open rates when mobile optimization is factored in, noting that mobile inboxes typically truncate after just 33–43 characters. The practical ceiling is under 50 characters if you want your full subject line visible before the open decision is made.
Sender name personalization is a lever that costs nothing to test. One documented A/B test recorded a +3.81% open rate increase when a real person’s name replaced a generic brand address in the “From” field. The effect isn’t universal – it depends on whether your audience has a relationship with an individual at your company – but it’s worth testing before assuming your brand name is the strongest option.
Send timing is real but routinely over-applied. Tuesday through Thursday mornings have historically shown stronger open rates, but the more honest advice is to test against your own audience’s behavior patterns. Generic “best time” charts are built from aggregate data that may have nothing to do with when your specific subscribers check email.
List hygiene is where open rates are won or lost before a single subject line is written. Removing subscribers who haven’t engaged in 90 days, keeping spam complaint rates strictly below 0.1% (Google and Yahoo’s enforcement threshold; never let it cross 0.3%), and using confirmed opt-in all directly improve inbox placement. And inbox placement is the prerequisite for any open at all – an email that lands in spam has a zero percent open rate regardless of how good the subject line is.
That last point is the one most open-rate guides skip. SPF, DKIM, and DMARC authentication aren’t technical housekeeping items – they’re the foundation that determines whether your emails arrive where people can see them. Without a deliverability baseline that includes blacklist monitoring and inbox placement testing, optimizing subject lines is like repainting a car with a broken engine. Every open-rate improvement strategy has to start with a deliverability audit, not end with one.
Apple Mail Privacy Protection: The Phantom Open Problem
Apple MPP open inflation is the single biggest structural distortion in email open rate data since 2021, and most marketers are still reporting numbers without correcting for it.
The mechanism is straightforward. Apple Mail Privacy Protection pre-fetches all email images – including tracking pixels – when an email is downloaded to a device, regardless of whether the recipient ever actually opens the message. That pixel fire registers as an “open” in your ESP. The recipient may have never seen your subject line, never scrolled to your CTA, never read a word – but your open rate just went up.
The scale of that distortion is significant. According to Litmus’s analysis of Apple MPP’s impact, MPP inflates open rates by an estimated 15–20%. A program reporting a 40% open rate may be seeing real human opens closer to 18–22% once Apple Mail users are accounted for. The distortion is concentrated in audiences with a high proportion of Apple Mail users – iCloud accounts, native Mail app on iPhone and Mac – so the effect varies by list composition, but it’s rarely negligible.
The practical implication: treat open rates as directional trend data, not precise attention metrics. A consistent upward or downward trend still tells you something meaningful. A single-point reading tells you almost nothing reliable.
The academic research on this problem reveals why it’s technically difficult to solve. ScienceDirect’s Journal of Operational Research, evaluating machine learning approaches to detecting email tracking elements, notes:
“The reason is that the identification of tracking images, which are the main tracking mechanisms in emails, poses specific challenges that render standard ad blockers and blacklists ineffective.”
If automated systems struggle to reliably distinguish legitimate tracking pixels from phantom fires, individual marketers certainly can’t do it manually at scale.
There’s a second-order problem that gets less attention. Because MPP artificially inflates the “open” denominator, it quietly breaks Click-to-Open Rate (CTOR) – the metric many marketers turned to as a replacement for raw open rate. When opens are systematically overstated, CTOR gets suppressed. Strong email creative looks weak. A campaign with genuinely compelling content appears to underperform simply because a privacy feature is manipulating the math underneath it.
The cleaner alternative is CTR calculated as clicks divided by delivered emails. That denominator bypasses the inflated-open problem entirely, giving you a signal that reflects actual click behavior without being contaminated by phantom opens.
The Metrics That Matter More Than Open Rate
Alternative engagement metrics give you a more honest read on email program health – but only if you understand what each one is actually measuring and where each one still has blind spots.
Click-Through Rate (CTR) – unique clicks divided by delivered emails – is the most reliable signal in a post-MPP environment. A healthy baseline sits between 2–3.5%. Because the denominator is delivered emails rather than opens, CTR is largely unaffected by Apple’s image pre-fetching. It measures whether your email moved someone to act, not just whether a pixel fired.
Click-to-Open Rate (CTOR) measures clicks per open and is useful for isolating content effectiveness from subject-line performance. If your CTR is low but your CTOR is strong, your subject line is the problem – the people who do open find the content worth clicking. If CTOR is weak, the content itself isn’t delivering. The important caveat: CTOR still uses opens as its denominator, so on Apple Mail-heavy lists, the inflated open count will suppress CTOR even when your content is strong. Use it directionally, with that correction in mind.
Revenue Per Email (RPE) – total campaign revenue divided by emails delivered – is the metric that most directly answers whether your email program is worth running. It bypasses bot activity, engagement-metric manipulation, and the entire open-rate measurement debate, connecting each send directly to business outcomes. A 30% open rate with near-zero conversion value is a less useful program than a 10% open rate that reliably generates revenue.
The point isn’t that opens don’t matter – it’s that they don’t pay bills on their own. MDPI’s Information Journal, analyzing multi-stage customer journeys in digital marketing, frames this clearly:
“One study adapts the AIDA framework, where Attention is linked to open rate, Interest to click-through behaviors such as CTR or CTOR, and Action to conversion outputs, while unsubscribe is considered as a retention measure.”
Open rate is the Attention layer. It tells you whether your envelope was picked up off the doorstep. Everything downstream – interest, action, revenue – depends on what happened after that. A program that optimizes only for opens is optimizing for the least consequential step in the chain.
For a practical walkthrough of how to pull CTR and RPE data directly from your ESP, this tutorial covers the mechanics inside Klaviyo:
The deeper issue is that the email industry’s public benchmark reports are almost entirely engagement-only. Open rates, CTR, CTOR – all of it stops short of revenue. The practitioner is handed a dashboard of attention metrics while the number that actually funds their program is left off the page. Building your own internal conversion-value baseline – what each email type earns, segmented by campaign and list segment – transforms the question from “are my numbers average?” to “is this campaign generating profit?”
A Diagnostic Framework: Is It Your Subject Line or Your List?
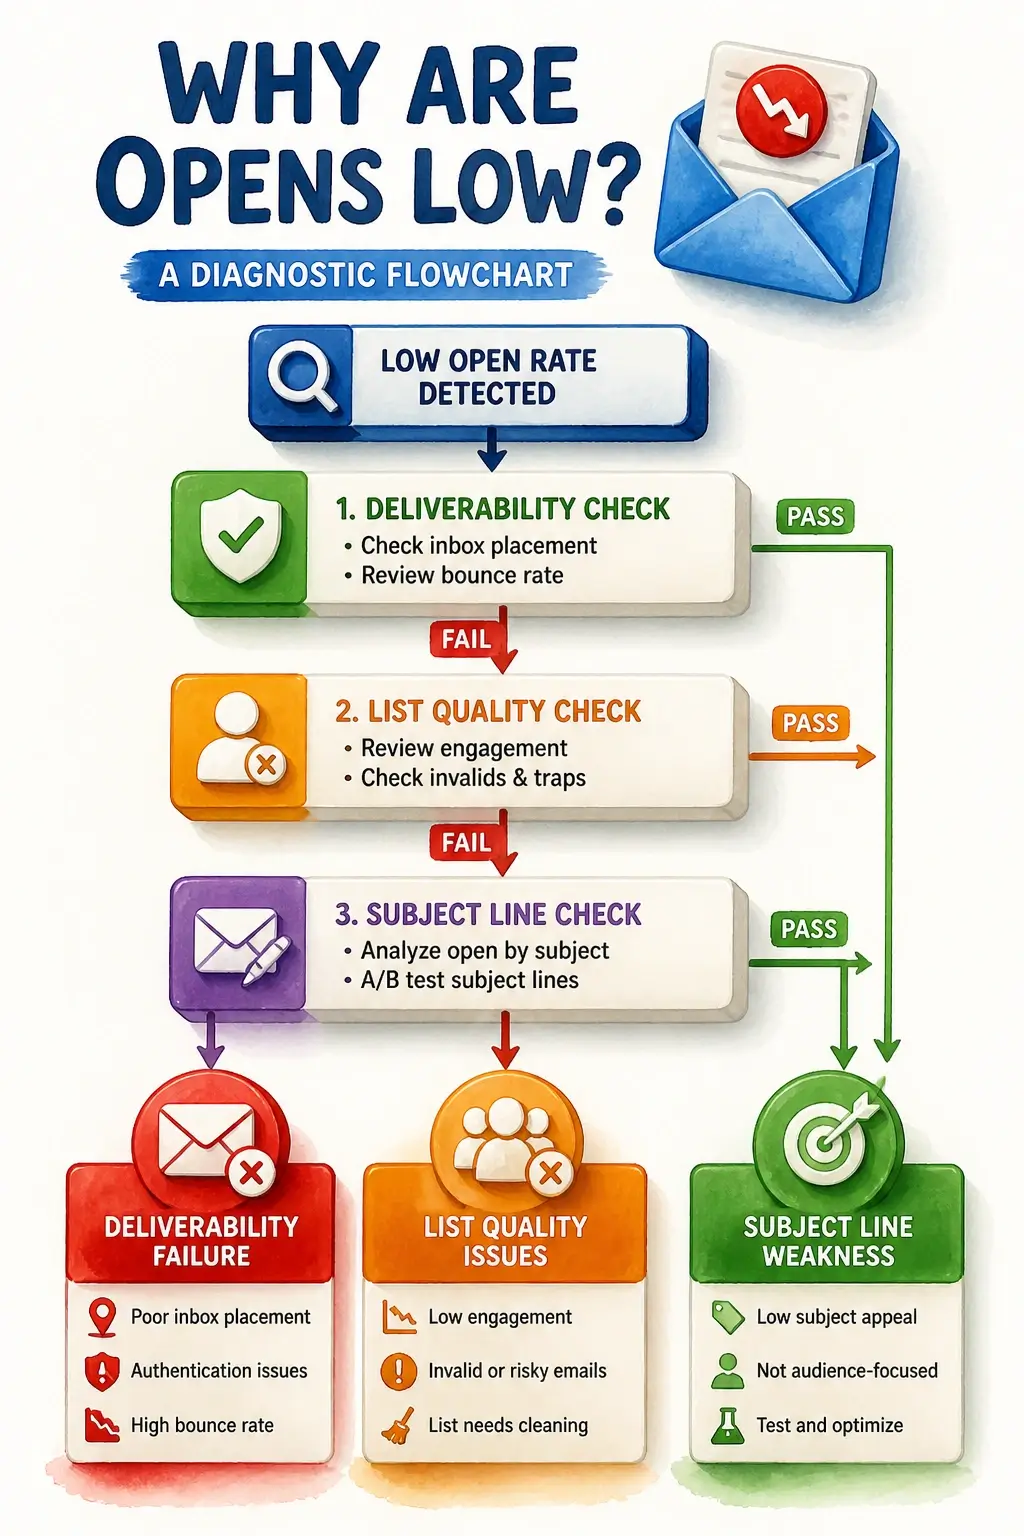
An open rate diagnostic workflow gives you a structured way to stop guessing and start isolating the actual cause of underperformance – because “my open rates are low” can mean four completely different things depending on where in the system the problem lives.
Step one: rule out deliverability first. Before you rewrite a single subject line, check whether your emails are actually landing in the inbox. Look for sudden open-rate drops that affect all domains simultaneously – that pattern suggests a sender reputation issue, not a content problem. Check for spam placement flags or blacklist hits. Verify that SPF, DKIM, and DMARC are correctly configured, and confirm your spam complaint rate is below 0.1%. A domain-specific drop – Gmail opens collapsing while Yahoo holds steady, for example – points to a platform-specific filtering issue rather than a list or creative problem. Deliverability failures are invisible in subject-line A/B tests.
Step two: assess list health if deliverability is clean. A sudden drop in open rates usually signals a deliverability or reputation event. A gradual multi-month decline is almost always a list health issue – either acquisition hygiene has slipped (you’re adding unengaged subscribers faster than you’re removing them) or send frequency has outpaced audience interest. Run a re-engagement campaign for subscribers who haven’t opened in 60–90 days. For those who remain silent after that campaign, apply a 90-day sunset policy and remove them. This feels counterintuitive – removing subscribers to improve performance – but a smaller, engaged list consistently outperforms a large, disengaged one on every metric that matters.
Step three: read the pattern, not just the number. Three combinations tell three different stories:
- Low open rate + high CTOR among openers: Your subject line is failing to pull people in, but the content itself is strong. The few who do open find it worth clicking. This is a subject-line problem.
- High open rate + low CTOR: People are opening but not engaging with the content. Subject line and list are working – expectation mismatch or weak content is the issue.
- Low open rate + low CTOR: This is the combination that points to list quality or deliverability, not creative. No amount of subject-line optimization fixes a list that shouldn’t be receiving your emails.
Here’s a visual decision path that ties these diagnostic steps together:
The Freshmail research published in MDPI Applied Sciences reinforces why real-time metric tracking – not post-campaign analysis – is what catches deliverability problems early:
“The paper describes a method that uses real-time tracking of key campaign metrics such as the opens count, clicks count, hard bounces count, etc., to identify campaigns that should be stopped because they can be classified as spam or phishing. The key point of this solution is that we do not analyse email content.”
The signal is in the behavioral data, not the copy. That’s the same principle behind this diagnostic framework: follow the metric pattern to the root, then fix the root.
The final prescription: stop chasing external benchmarks as your primary reference point. Build an internal rolling 12-month baseline, segmented by email type and list cohort. When performance drifts, run this diagnostic sequence against your own history first. Your program’s past behavior is a far more relevant benchmark than any industry report – because it accounts for your list, your audience, your cadence, and your sender reputation. External benchmarks tell you where the industry is. Your internal baseline tells you whether you’re improving.
Key Takeaways on Email Open Rate Benchmarks
- The blended average of 35–44% masks sector gaps wide enough to make it useless without knowing your specific industry and list profile.
- A 13-percentage-point spread in e-commerce open rates across platforms proves there is no single industry average – only platform-biased snapshots.
- Apple Mail Privacy Protection inflates open rates by an estimated 15–20%, making raw open rate an unreliable measure of actual audience attention.
- CTR (clicks ÷ delivered) is a more honest engagement signal than open rate because it bypasses the phantom-open problem entirely.
- Low open rate combined with low CTOR points to list quality or deliverability failure, not a subject-line or content problem.
- Your own rolling 12-month internal baseline is a more actionable benchmark than any published industry report.
Frequently Asked Questions About Email Open Rate Benchmarks
What is a good benchmark for email open rates?
There’s no single answer that fits every program, but a reasonable working target for most industries is 25–35% – with nonprofit, education, and triggered flows running higher. More importantly, your own trailing 12-month average is a better benchmark than any published figure, because it accounts for your specific list, cadence, and sender reputation.
Is a 25% email open rate good?
It depends entirely on your industry and how you’re measuring. For e-commerce batch campaigns, 25% is competitive. For a B2B newsletter or a nonprofit list, it’s below average. And if Apple Mail users make up a significant share of your list, your real human-open rate may be closer to 12–15% – so 25% reported might actually be a strong result.
What is the 60/40 rule for email?
The 60/40 rule refers to the recommended content-to-image ratio in email design: at least 60% text and no more than 40% images. Emails that are image-heavy trigger spam filters on some clients because filters can’t read image content, and the low text-to-image ratio looks like a common spam pattern.
What is the 80/20 rule in email marketing?
In email marketing, the 80/20 principle typically means 80% of your results come from 20% of your list – usually your most recently acquired, most engaged subscribers. It’s also applied to content strategy: roughly 80% value-driven or educational content and 20% promotional sends, though the ratio varies widely by audience and program type.
Can I trust benchmark reports from my ESP?
Treat them as directional reference points, not precise targets. Every major ESP reports benchmarks based on its own client mix, and none of them disclose sampling methodology or geographic distribution. A platform built around e-commerce clients will produce different “industry averages” than one built around B2B companies – even for the same sector.
Why did my open rates jump after switching ESPs?
Different platforms calculate “unique opens” and “delivered” differently. A jump after migration often reflects a methodological difference in how your new ESP counts opens, not a genuine improvement in audience engagement. Run at least 90 days of sends on the new platform before drawing conclusions from the numbers.
Should I stop tracking open rates entirely?
No – but stop treating them as a precise measure of attention. Open rates are still useful for spotting directional trends, running A/B tests on subject lines, and flagging sudden deliverability problems. Just pair them with CTR and revenue per email to get a complete picture of whether your program is actually working.
How do I know if a low open rate is a deliverability problem or a list problem?
Check the pattern across domains first. If open rates drop simultaneously across Gmail, Yahoo, and Outlook, that’s a sender reputation or deliverability issue. If the decline is gradual over months and spread evenly, it’s almost always list fatigue or poor acquisition hygiene. Run a re-engagement campaign, sunset the non-responders, and watch whether rates recover before touching your creative.
References
- MDPI – Multimodal Technologies and Interaction Journal: Email Marketing Metrics Analysis – mdpi.com
- MDPI – Information Journal: AIDA Framework and Digital Marketing Metrics – mdpi.com
- Advances in Social Sciences Research Journal – The Effect of Subject Lines on Open Rates of Email Marketing – journals.scholarpublishing.org
- Litmus – Apple Mail Privacy Protection Open Rate Inflation – litmus.com
- ScienceDirect – Journal of Operational Research: Machine Learning Detection of Email Tracking Elements – sciencedirect.com
- MDPI – Applied Sciences: Real-Time Email Campaign Monitoring (Freshmail) – mdpi.com