
Reliable email open rate benchmarks are harder to find than most marketing blogs admit. The numbers you see – ranging from 15% to over 43% depending on the source – don’t just reflect industry differences. They reflect list composition, measurement methodology, and how much Apple Mail Privacy Protection has quietly inflated the underlying data.
Before you decide whether your 22% open rate is a win or a warning sign, you need to understand what those published averages are actually measuring. Spoiler: it’s not always human attention.
Email Open Rate Benchmarks: What the Numbers Actually Show
Industry-specific email open rate benchmarks don’t converge on a single “good” number – they scatter across a 20-plus-point range depending on the sector, the data source, and the measurement method behind the average. That’s not a data quality problem you can fix by finding a better report. It’s the actual shape of the landscape.
The open rate formula itself is straightforward: unique opens ÷ delivered emails × 100. What’s not straightforward is what counts as an “open” in any given dataset, and which emails made it to the delivered column in the first place. Keep that formula in mind as you read the ranges below – the math is simple, but the inputs are messy.
Here’s what publicly cited datasets show across major verticals:
| Industry | Reported Open Rate Range | Notes |
|---|---|---|
| Nonprofit | 35–40% | High personal relevance drives strong engagement |
| Education & Training | 30–35% | Expected content; readers self-select into lists |
| Health & Fitness | 25–30% | Motivated audiences; high-intent sign-ups |
| B2B (general) | ~21% | Heavily filtered by spam and security tools |
| Retail / E-commerce | 17–20% | High volume, high list churn, promotional fatigue |
| Overall reported average | 20–30% | Some sources cite up to 43.46% |
The nonprofit and education sectors sit at the top because their audiences opted in with genuine intent and their list churn is lower. Retail sits at the bottom partly because of volume – high-frequency senders naturally see lower per-send open rates – and partly because promotional email is the most competitive inbox category.
The overall reported averages tell a similarly fractured story. Most sources place the cross-industry mean somewhere between 20% and 30%, but MailerLite’s dataset lands at 43.46% while Monday.com’s sits between 15% and 25%. That 28-percentage-point spread between two credible sources isn’t explained by industry mix alone. It’s explained by the invisible variables: how much of each vendor’s user base routes through Apple Mail, and whether the dataset includes automated flows or campaign sends only.
Automated flows – welcome series, abandoned cart, re-engagement sequences – consistently outperform one-time campaign sends because they reach people at high-intent moments. A benchmark built on a dataset heavy in automated flows will read higher than one built on pure broadcast campaigns. Neither is wrong. Both are useless as a direct comparison to your numbers unless you know which type of send your own data represents.
The practical takeaway for any intermediate marketer: treat published benchmarks as directional context, not targets. Your own historical trend line – what your open rate was doing three months ago versus today – is the only number that tells you whether something has changed and whether you need to act.
Why Email Benchmarks Keep Lying to You
Open rate distortion factors don’t announce themselves in your ESP dashboard. They operate quietly in the background, bending your numbers before you ever see them – and they bend published benchmarks the same way, which is why comparing your rate to an industry average is often a comparison between two corrupted datasets.
Two forces do most of the damage: list quality differences that nobody discloses when publishing benchmark data, and Apple Mail Privacy Protection, which has been structurally inflating open counts since 2021.
List Quality: The Invisible Open Rate Driver
Email list quality is the factor that benchmark reports almost never control for, which makes their averages nearly impossible to use as a fair comparison. A clean, actively engaged list – one built through organic sign-ups, regularly pruned of stale addresses, and free of spam traps – can produce open rates that are double or more what a neglected or purchased list generates. When two marketers in the same industry compare open rates, they may be comparing a well-maintained list against one that hasn’t been cleaned in two years. The benchmark says they’re peers. The data says otherwise.
Poor list hygiene drags down opens through two separate mechanisms. First, it damages deliverability directly – spam traps and high bounce rates signal to inbox providers that your sending domain is unreliable, which pushes more of your emails into spam or promotions folders before a human can decide whether to open them. Second, unengaged subscribers who never open suppress your overall rate mathematically, even when your active segment is performing well. The result is an open rate that looks like a content problem but is actually a list health problem – and no amount of subject line testing will fix it.
Apple MPP and the Measurement Crisis
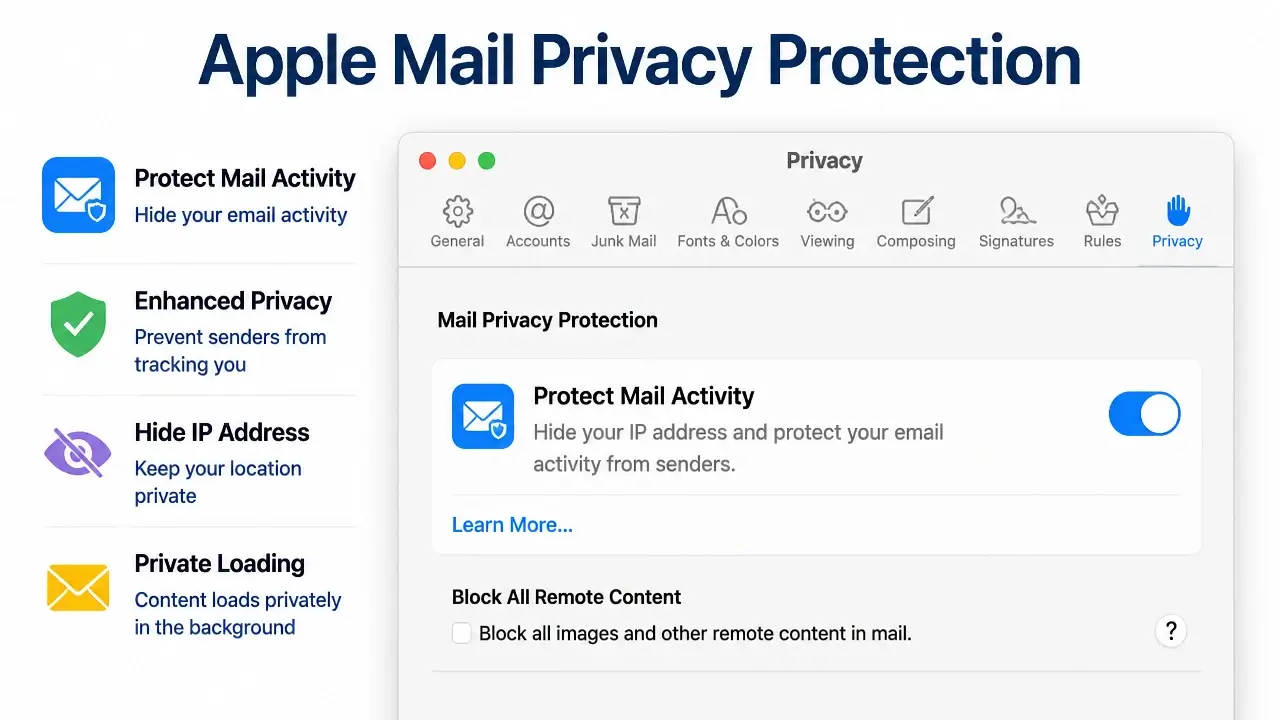
Apple Mail Privacy Protection works through a proxy server that pre-fetches email content – including the tracking pixel that registers an open – the moment an email arrives, regardless of whether the recipient ever looks at it. The “open” event fires on Apple’s server, not in the recipient’s inbox. From your ESP’s perspective, the email was opened. From a human engagement perspective, it may have been ignored entirely.
The scale of this distortion is significant. Research indicates that roughly 50% or more of opens recorded for Apple Mail users can be machine-driven, pushing overall open rates up by 15–20 percentage points – and sometimes more for lists with heavy Apple Mail penetration. For a marketer whose audience skews toward iPhone and Mac users, this isn’t a minor measurement quirk. It’s a structural inflation that makes the top-line open rate functionally unreliable as an engagement signal.
This is the direct explanation for the 28-percentage-point spread between major benchmark sources. According to MailerLite’s email marketing metrics data, their reported benchmark reaches 43.46%, while Monday.com’s sits between 15% and 25%. That gap isn’t primarily year-over-year variation or industry mix – it mainly reflects how much Apple MPP corruption each vendor’s user base contains. No source provides a correction formula or a method to isolate genuine human opens from MPP-inflated opens, so every published benchmark inherits an unknown quantity of false data.
Comparing your open rate to these benchmarks is like comparing your car’s fuel economy to a published average without knowing whether the test was run on a highway or in stop-and-go traffic. The number exists. It just doesn’t apply to your situation.
This measurement crisis means the concept of a “good” open rate can’t be answered without three pieces of information: your list’s Apple Mail share, your deliverability baseline, and your engagement history. The industry’s silence on this gap is the real story behind the misleading benchmarks.
The Real Drivers of Open Rates (and Why AI Won’t Save You)
Open rate improvement levers are fewer than most vendor content suggests, but they’re more powerful than most marketers apply them. Four fundamentals account for the overwhelming majority of open rate variance – and mastering them matters far more than adopting any AI-driven optimization tool before these basics are solid.
Here’s how each lever works and why it matters:
- Subject line: Length, clarity, and the presence of a specific benefit or curiosity gap all influence the sub-second scan that determines whether someone opens. Shorter lines – typically under 50 characters – tend to outperform because they display fully on mobile without truncation and force the writer to be precise. Personalization helps when it’s contextually relevant, not just a first-name merge tag.
- Sender name: A recognizable, human-format name (“Sarah from [Brand]”) consistently outperforms a generic brand name or no-reply address. The sender name is often the first thing a recipient reads, and familiarity builds the kind of reflexive trust that triggers an open before the subject line is even processed.
- Send time: Aligning delivery with the recipient’s actual reading window – derived from your own engagement history, not generic “best day to send” charts – lifts opens by reaching people when they’re already in inbox mode. This requires looking at your own historical data, not an industry average.
- List hygiene: Removing hard bounces, suppressing chronically unengaged subscribers, and purging spam traps protects sender reputation. Inbox placement is a prerequisite for opens. An email that lands in spam can’t be opened regardless of how good the subject line is.
These four levers interact. A strong subject line won’t recover an email that went to the promotions folder because of a damaged sender reputation. Perfect send timing won’t help a sender name that nobody recognizes. The sequence matters: fix deliverability first, then sender recognition, then subject line craft.
Continuous A/B testing on each lever individually – not simultaneously – is how you build the signal to know which variable is doing the work. Testing subject line length and sender name in the same experiment gives you a winner but no mechanism. Test one variable at a time.
One other thing worth naming directly: the narrative that automated flows dramatically outperform standard campaigns – often cited as 3× higher click rates or 13× higher placed-order rates – is not a story about automation. It’s a story about intent. Welcome series and abandoned cart emails reach people at moments of high motivation. The automation is just the delivery mechanism. The practical implication is to prioritize triggering messages at high-intent moments – post-purchase, re-engagement windows, sign-up confirmation – rather than investing in AI personalization tools before the fundamentals are working.
Here’s a visual summary of where each driver fits in the overall open rate picture:

ScienceDirect (Elsevier, 2022), in their peer-reviewed study Leveraging email marketing: Using the subject line to anticipate the open rate, makes the mechanism explicit:
“Since the sender and the subject line are the only information that the recipient sees at first when receiving an email, the decision to open an email critically depends on these two factors, which should stand out and catch the recipient’s attention.”
This is the part that AI optimization tools tend to obscure: the decision to open happens in a fraction of a second, based on two variables the marketer fully controls. No algorithm changes that cognitive sequence. What AI can do is help you generate more subject line variants to test – but the testing discipline, the list health, and the sender reputation still require human attention and operational consistency.
How Apple’s Mail Privacy Protection Inflates Your Open Rates
MPP open rate inflation isn’t a theoretical concern for lists with significant Apple Mail users – it’s the dominant distortion in most B2C and prosumer email programs running today. Understanding the mechanism is what lets you stop misreading your own dashboard and start using metrics that actually reflect human engagement.
The Server-Side Pre-Fetch Mechanism Behind MPP
Apple MPP’s server-side pre-fetch mechanism works like this: when an email arrives in an Apple Mail inbox, Apple’s proxy servers download the email content in advance – including the invisible 1×1 tracking pixel that your ESP uses to register an open event. That pixel fires on Apple’s infrastructure, not in response to a human opening the message. Your ESP records an open. The recipient may have never seen the subject line.
Research on the scale of this problem indicates that roughly 50% or more of opens attributed to Apple Mail users can be machine-driven. For a list where Apple Mail represents a significant share of recipients, this translates to an overall open rate inflation of 15–20 percentage points – sometimes more. A campaign that reports a 38% open rate might reflect 20% genuine human attention and 18 points of machine-generated noise.
The downstream effect is that open rate stops functioning as a reliable proxy for interest. An email that appears to have strong performance – based on open rate alone – may have weak actual human attention. Decisions made on that signal – scaling send frequency, attributing revenue to a campaign, judging subject line performance – inherit the distortion.
Here’s what the Apple Mail Privacy Protection setting looks like from the recipient side, which helps explain why so many users have it enabled by default:
Click-to-Open Rate as a More Reliable Engagement Metric
Click-to-open rate (CTOR) sidesteps much of the MPP distortion by measuring deliberate action rather than passive pixel-firing. The formula: unique clicks ÷ unique opens × 100. Because a click requires a human to read enough of the email to decide something is worth pursuing, it’s a materially stronger signal than an open event – especially in an environment where open events are routinely machine-generated.
The Geysera benchmark report analyzing 3.6 million campaigns puts the average CTOR at 6.81% for 2025–2026. The Prospeo click-to-open ratio guide reports the same post-MPP median, up from 5.63% in 2024, and notes that the rise partly reflects inflated open denominators reducing CTOR – a reminder that even this metric isn’t immune to MPP effects. For context, Suped’s deliverability knowledge base outlines how ESPs use behavioral timing and IP analysis to filter non-human interactions, underscoring why click data – when cleaned – remains a stronger intent signal than open data.
That said, there’s a gap the industry rarely acknowledges: no public study has yet proven that improving CTOR directly increases revenue or lifetime value. The logic is sound – clicks require intent – but the empirical link to downstream business outcomes remains unvalidated in peer-reviewed literature. For a practitioner, this means CTOR is an excellent diagnostic tool but shouldn’t replace conversion tracking as your ultimate performance bar.
Use CTOR as your best available substitute for opens in the post-MPP era. Then supplement it with reply rates and conversion metrics – purchases, sign-ups, booked calls – especially for cold outreach or transactional sequences. The combination gives you a layered engagement picture that no single metric provides alone.
A useful diagnostic pattern: high open rate combined with low CTOR almost always signals a content mismatch – your subject line set an expectation the email body didn’t fulfill. Low opens with adequate CTOR points toward list quality or deliverability, not messaging. That distinction changes what you fix first.
Open Rate Diagnosis: Subject Line Problem or List Quality Problem?
An open rate diagnostic framework turns the abstract knowledge from previous sections into a concrete sequence you can run on your next campaign review. The goal is to stop asking “is my open rate good?” and start asking “what specific signal is my open rate giving me, and what do I do about it?”
Here’s the five-step sequence, written for immediate application:
Step 1 – Trend check: Pull your open rate data for the last 3–6 months and look at the shape of the line, not the absolute number. A sudden drop – week-over-week or campaign-over-campaign – typically signals a technical or list-health event: a spam filter change, a deliverability issue, or a large batch of stale addresses hitting hard bounces. A slow, steady decline over months usually indicates growing audience disengagement, which is a content and frequency problem. The shape of the trend tells you whether you’re dealing with an acute issue or a chronic one.
Step 2 – Apple Mail domain segmentation: If your ESP allows domain-level open rate reporting, segment your opens by email domain and compare Apple Mail opens against Gmail, Outlook, and others. If your Apple Mail open rate is dramatically higher than non-Apple domains, your top-line number is inflated – and you should mentally adjust your benchmark downward before drawing any conclusions. This single check often explains a confusing gap between what your dashboard shows and how your campaigns feel.
Step 3 – CTOR litmus test: For recent campaigns where opens appear acceptable, run the CTOR calculation. If your CTOR is well below the ~6.8% industry average, you have a subject line or content mismatch problem. People are opening based on the subject line’s promise, then finding an email that doesn’t fulfill it – so they don’t click. The fix is subject line and preview text testing, not list cleaning.
Step 4 – List engagement signal: For campaigns with low opens overall, check whether the subscribers who do open are still clicking. If CTOR is adequate among openers, the problem lives upstream of the open event – in list quality or inbox placement, not in your messaging. At this point, check bounce rates, spam complaint rates, and the ratio of subscribers who haven’t opened anything in the last 90 days.
Step 5 – Unsubscribe and spam complaint confirmation: Spikes in unsubscribes or spam reports after a specific send are strong indicators of content or frequency problems – you sent something the audience didn’t expect or didn’t want. Chronic deliverability issues (consistent high bounces, suppressed inbox placement) point to list hygiene as the root cause, independent of any single campaign.
The action triggers for each diagnosis are straightforward:
- Low CTOR despite acceptable opens → test new subject lines and preview text combinations
- Low opens but adequate CTOR among openers → schedule a list clean and re-engagement campaign
- Sudden open rate drop → audit deliverability, check for recent spam filter changes, review bounce logs
- Slow open rate decline → review send frequency and content relevance; consider segmentation
This walkthrough covers the diagnostic mechanics in detail – including how to segment by domain and run a CTOR report inside a real ESP environment:
The framework’s real value is that it removes the need to compare yourself to external benchmarks at all. MDPI Applied Sciences (2023), in Email Campaign Evaluation Based on User and Mail Server Response, describes exactly this internal-signal approach:
“The paper describes a method that uses real-time tracking of key campaign metrics such as the opens count, clicks count, hard bounces count, etc., to identify campaigns… instead of analysing the content of an email, we use statistics collected by the ESP system on the response of servers and subscribers (recipients).”
Your own ESP data – the response patterns of your specific list, across your specific sending history – is a more accurate diagnostic instrument than any published benchmark. External numbers give you rough context. Your own trend data tells you what to fix.
Key Takeaways on Email Open Rate Benchmarks
- No single “good” open rate exists – benchmarks split from 15% to 43% depending on industry, list composition, and measurement method.
- Apple Mail Privacy Protection inflates open rates by 15–20 percentage points for lists with significant Apple Mail users, corrupting both your data and published benchmarks.
- The 28-point spread between benchmark sources is primarily an Apple MPP artifact, not a meaningful industry difference.
- Click-to-open rate (CTOR) is a stronger engagement diagnostic than open rate, but it doesn’t replace conversion tracking as your real performance measure.
- High opens with low CTOR signals a subject line mismatch; low opens with adequate CTOR signals a list quality or deliverability problem.
- Your own historical trend line is more actionable than any external benchmark – run the five-step diagnostic before drawing conclusions from a single number.
Frequently Asked Questions About Email Open Rate Benchmarks
What is a good benchmark for email open rates?
There’s no single good benchmark – it depends on your industry, list quality, and how much Apple Mail MPP has inflated your numbers. A nonprofit list might reasonably target 35–40%, while a retail program at 18% could be performing well given its volume and audience churn.
Is a 25% email open rate good?
It depends on your industry and list composition, not the number in isolation. A 25% rate for a B2B cold outreach list is strong; for an education or nonprofit list, it’s below average. More importantly, check whether that 25% includes significant Apple MPP machine-opens before treating it as a real engagement signal.
Why do different benchmark sources report such different open rates?
The gap mainly comes from two variables: how much of each vendor’s user base routes through Apple Mail (which inflates opens via server-side pre-fetching), and whether the dataset includes automated flows or campaign sends only. Neither source is wrong – they’re just measuring different conditions.
What is the 80/20 rule in email marketing?
In practice, it typically refers to the observation that roughly 20% of your subscribers drive 80% of your opens and clicks. The implication is that segmenting and prioritizing that engaged segment – rather than blasting your full list – produces better deliverability and more consistent results.
What is the 60/40 rule for email?
The 60/40 rule is a content-to-promotion ratio guideline suggesting that roughly 60% of your email content should provide value – education, insights, utility – and 40% can be promotional. It’s a heuristic for maintaining audience trust rather than a statistically validated benchmark.
Should I stop tracking open rates entirely because of Apple MPP?
Don’t abandon open rate tracking – use it as a directional trend signal rather than an absolute measure. The more important shift is to weight CTOR, reply rates, and conversion metrics more heavily in your performance assessment, especially for any list with significant Apple Mail penetration.
How do I know if my open rate drop is a deliverability problem or a content problem?
Run Step 4 of the diagnostic framework: check whether the subscribers who do open are still clicking. If CTOR holds steady among openers but overall opens have dropped, the problem is upstream – deliverability or list quality. If CTOR has also dropped, the issue is content or subject line relevance.
Can I improve my open rate without touching my subject lines?
Yes – sender name recognition, send time alignment with historical engagement data, and list hygiene often move open rates more than subject line changes alone. Fix deliverability and remove chronically unengaged subscribers before assuming the subject line is the bottleneck.
References
- Email Marketing Metrics and Benchmarks – mailerlite.com
- Email Click-Through Rate Benchmarks 2026 [3.6M Data] – geysera.com
- Click to Open Ratio in 2026: Real Benchmarks & Guide – prospeo.io
- How do ESPs reliably distinguish human vs. bot email opens and clicks – suped.com
- Leveraging email marketing: Using the subject line to anticipate the open rate – sciencedirect.com
- Email Campaign Evaluation Based on User and Mail Server Response – mdpi.com